How accurate are prediction markets? What the track record of Polymarket, Kalshi and their predecessors shows
Favourites in prediction markets win most of the time, and their prices are well calibrated on average. The evidence from Polymarket, the Iowa Electronic Markets and a century of election betting, the famous misses, and the biases to watch.
In this article
Prediction markets are accurate on average, not always right. Across thousands of questions, outcomes priced at 70% tend to happen about 70% of the time, and the favourite usually wins. But a 70% chance still fails three times in ten, and some markets, especially thin or long-dated ones, are much less reliable than others.
This article looks at the evidence: what "accurate" means, the track record from old Wall Street election betting to Polymarket, the best-known misses, and the biases that skew prices.
Two ways to measure accuracy
- Hit rate: how often the favourite (the outcome above 50%) actually happens. Easy to understand, but it treats a 51% favourite the same as a 99% one.
- Calibration: whether prices match frequencies. If you collect every market priced near 30%, about 30% of them should resolve "Yes". Calibration is usually measured with the Brier score.
A good forecaster needs both: favourites that win, and probabilities that mean what they say.
The track record
Polymarket
Analyses of Polymarket's resolved markets have found:
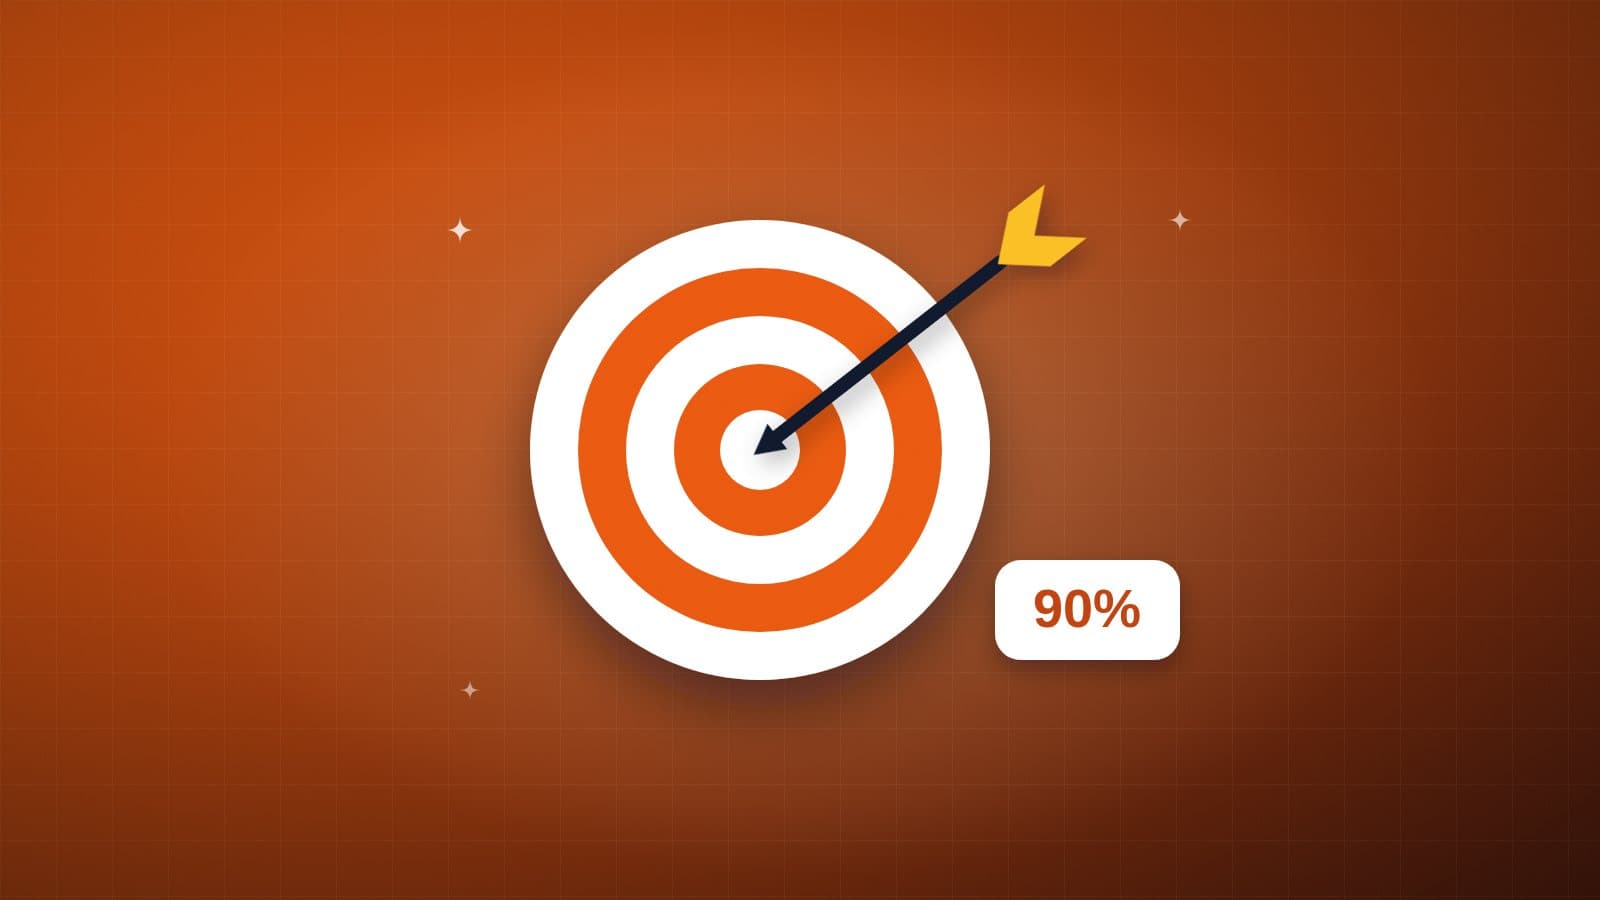
- The leading outcome was right about 90% of the time a month before resolution, rising to about 94% a few hours before (a widely cited analysis of Polymarket data published in 2024).
- Calibration is good overall and improves as resolution nears; independent studies of thousands of resolved markets report Brier scores of roughly 0.03 to 0.09 depending on how far ahead prices are measured.
These figures are platform-wide averages. Busy markets on elections, sports and economic data drive them; a thin market on an obscure question can be far off.
The Iowa Electronic Markets
The University of Iowa has run small real-money election markets since 1988. In a comparison with 964 opinion polls across the five presidential elections from 1988 to 2004, the market's forecast was closer to the final result 74% of the time. Markets were most useful far from election day, when single polls swing around.
A century of Wall Street election betting
Before polling existed, New Yorkers bet heavily on presidential elections through brokers on the Curb Exchange. Economists Paul Rhode and Koleman Strumpf studied these markets from 1868 to 1940 and found they did a remarkable job: in only one election, 1916, did the candidate clearly favoured in the betting a month before election day lose (Charles Evans Hughes to Woodrow Wilson). The story of those markets and what came after: a short history of prediction markets.
Kalshi
Kalshi's markets are younger and many settle on official data (inflation, jobs, Fed decisions) where prices converge on the consensus of economists and then react to the release. Kalshi and Polymarket prices on the same event usually sit within a few points of each other, so the two platforms' track records tell much the same story. Where and why they differ: prediction market arbitrage.
The famous misses, and what they mean
- Brexit, 2016: markets made "Remain" a clear favourite going into the vote.
- Donald Trump, 2016: markets gave him roughly 20–25% before election day.
- The 2022 midterms: markets expected a stronger Republican performance in the Senate than voters delivered.
Each miss feels like proof that markets are wrong. But a 25% outcome should happen one time in four. A forecaster whose 25% calls never happen is badly calibrated too. The real test is the long run across many questions, and there markets hold up well.
Why markets get things right
- Money on the line: traders who are wrong lose money, and traders who are right gain it and grow their influence on the price.
- Information from everyone: a price pulls together polls, models, insider knowledge, news and hunches in one number.
- Speed: prices update within minutes of news, while polls and models take days.
Biases that make prices less accurate
- Favourite-longshot bias: longshots tend to be overpriced. A 3¢ outcome usually happens less than 3% of the time, because buying cheap lottery tickets is fun and selling them ties up a lot of money for little return.
- Long-dated markets drift toward 50%: money tied up for two years earns nothing (unless the platform pays interest or rewards), so traders demand a discount on near-certain outcomes far in the future.
- Thin markets: with little volume, one trader can move the price. Check the volume and spread (what volume and spread mean).
- Whales and manipulation: a determined trader can hold a price away from fair value for a while. In 2012 one Intrade trader spent heavily to prop up Mitt Romney's price; the price eventually snapped back.
- Rules risk: a market can be right about the world and still resolve differently because of how its rules are worded (how markets resolve).
How to read a prediction market price sensibly
- Check liquidity first: a price on a market with tight spreads and steady volume deserves much more trust.
- Compare platforms: if Kalshi and Polymarket agree, the price is probably close to the market's best estimate. Our election hub and Compare page show both side by side.
- Watch the trend, not one tick: a price that has moved steadily for a week means more than a spike in a minute.
- Remember what 70% means: three times in ten, it does not happen.
Prediction market accuracy: frequently asked questions
How accurate is Polymarket?
Its favourites have won about 90% of the time a month before resolution and about 94% hours before, and its prices are well calibrated on average. Individual thin markets can be far off.
Are prediction markets more accurate than polls?
Usually, especially far from an event. They are not independent of polls, though: traders read polls and models, then add other information.
Why did prediction markets get 2016 wrong?
They gave Trump about a one-in-four or one-in-five chance. That is an unlikely outcome, not an impossible one.
Can prediction markets be manipulated?
For short periods on thin markets, yes. On busy markets, pushing a price away from fair value is expensive because other traders take the other side.